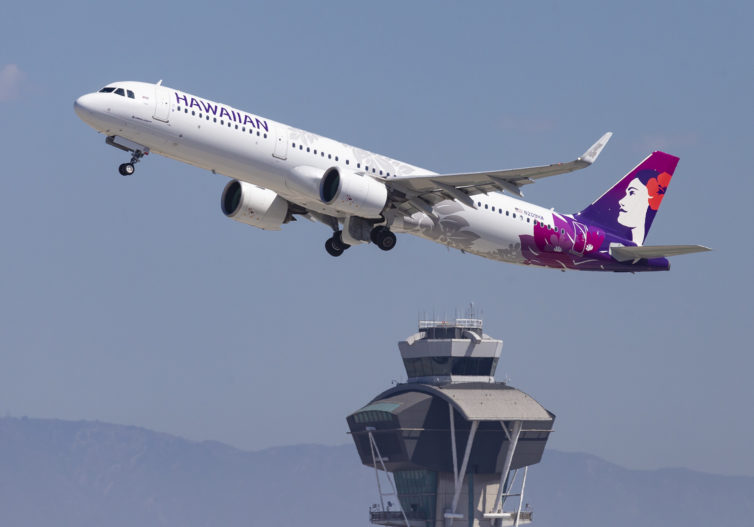
Hawaiian’s A321neos have been grounded by COVID-19; this aircraft is seen departing LAX in September 2019 – Photo: Nick Benson
For those following the impacts of COVID-19 on American aviation closely, it’s been an exhausting couple of months. Airlines have been hemorrhaging money, arguing for CARES Act exemptions from a fairly-inflexible DOT, and reducing their employment obligations to tens of thousands of employees. The full impact of the crisis on aviation, and the economy at large, still isn’t known.
The airlines have been reacting to the decreased demand for passenger flights by operating fewer flights with fewer aircraft. Being the avgeek I am, I was interested to see the evolution of each airline’s fleet as it reacted to COVID-19 – which types are getting hit hardest? Do airlines have a preference for newer, more efficient equipment, despite decreased fuel costs? There has been some coverage of the overall number of flights getting operated, pre-crisis vs. post-crisis scheduling, but I was interested to see how many aircraft each airline was actually operating.
The charts that follow show the total number of unique aircraft that flew for each airline, by type, each week from 30 December 2018 through 26 April 2020. This includes all flights that were detected, primarily derived by ADS-B reports, to JetTip’s data provider, including ferry, maintenance, cargo, etc. In other words, not all of these flights were necessarily revenue passenger flights – several carriers are doing cargo-only flights with their heavies now, and some flights are being operated to keep up with maintenance requirements.
